Year two with Mira

Gulf Shores,
Alabama.

A second season.
A stronger revenue total.

The home opened in late 2024 and joined Mira in January 2025, before its first full season. Both comparison years were under Mira management.

January–October rental revenue increased from $162,644 in 2025 to $186,515 in 2026. The observed increase was $23,871, or 14.7%. Local market RevPAR rose 2.5% over those months.

THREE-BEDROOM HOMEONE PROPERTYJOINED JANUARY 2025

Selected result; outcomes vary. Revenue before service fees and operating costs. Source records await validation.

Same property. Same ten months.

+14.7%

January–October 2025 vs. January–October 2026
Rental revenue, before service fees and operating costs.

+$23,871

Observed rental-revenue change across January–October.

+14.7%

Year two versus year one, both under Mira management.

+2.5%

Local market RevPAR change over the same months.

The comparison in detail

Ten months.
Every month in view.

Rental revenue was higher in 9 of the 10 matched months. The charts keep the calendar periods consistent and the measures separate.

RENTAL REVENUE

Month by month.

20252026

January–October 2025 vs. January–October 2026.

Monthly rental revenue in dollars. Exact values are available in the data table below.
View the revenue data
Monthly rental revenue in dollars
Month20252026
Jan$2,385$3,847
Feb$5,885$7,490
Mar$13,053$17,381
Apr$14,046$15,104
May$20,594$24,765
Jun$24,955$28,666
Jul$34,929$36,905
Aug$15,139$19,065
Sep$16,405$18,493
Oct$15,253$14,799
Total$162,644$186,515

PERFORMANCE CONTEXT

The period matters.

94–97%

Reported property occupancy across May–September 2026.

2.1×

Property RevPAR relative to its local market, January–October 2026.

Both years

This compares two periods with Mira, rather than a before-Mira season.

This is a second-year operating comparison. Listing maturation and other changes can affect the result.

Source: Mira client-results draft, November 2026 . Displayed arithmetic checked; underlying source records await validation. Selected individual results; outcomes vary.

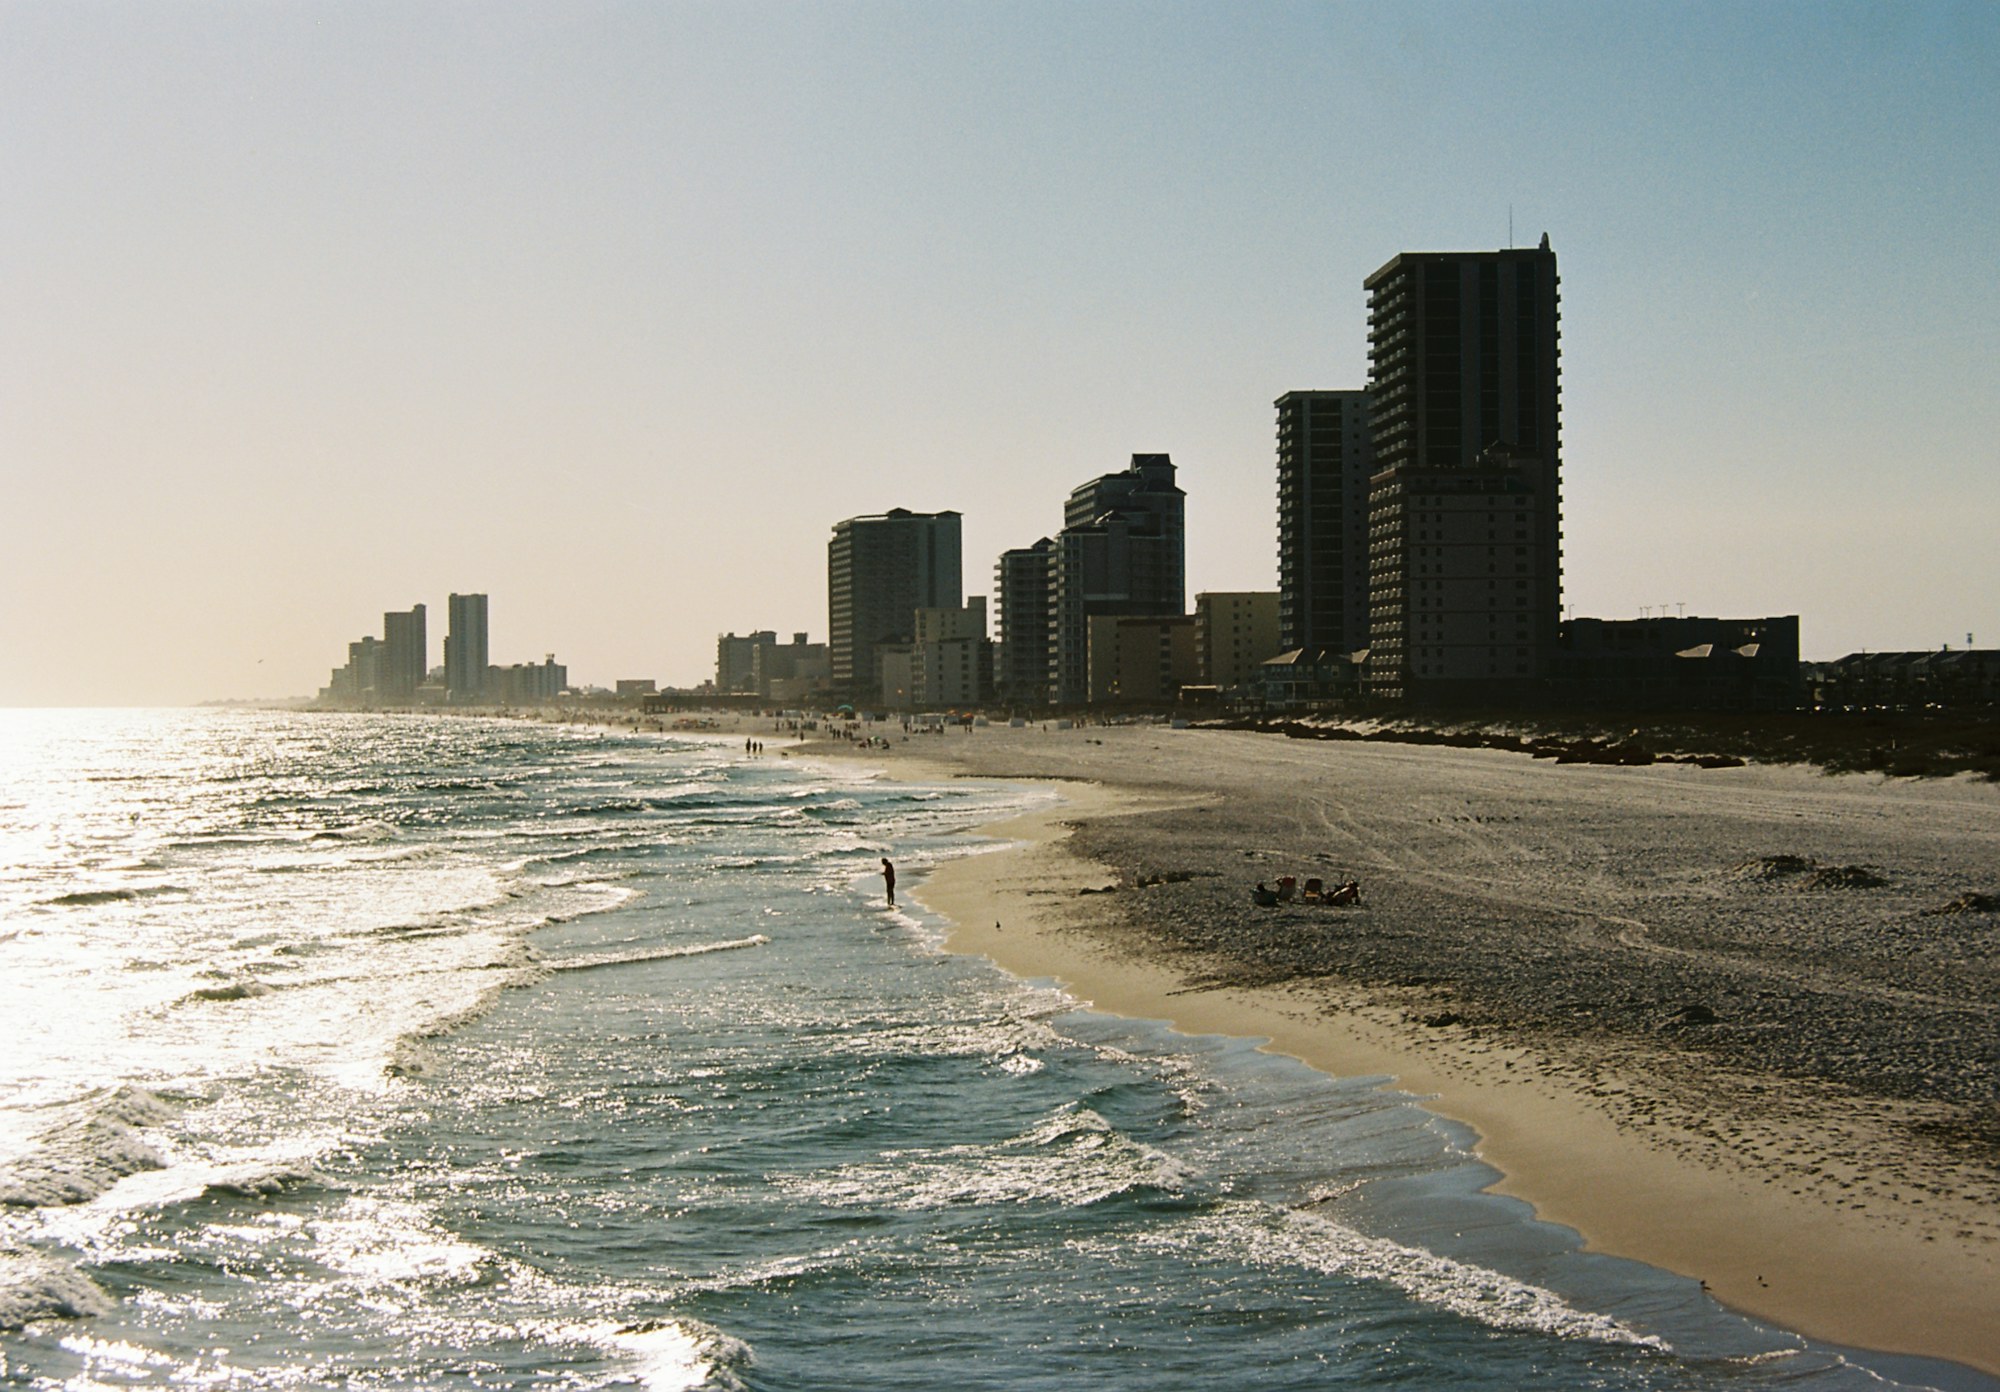
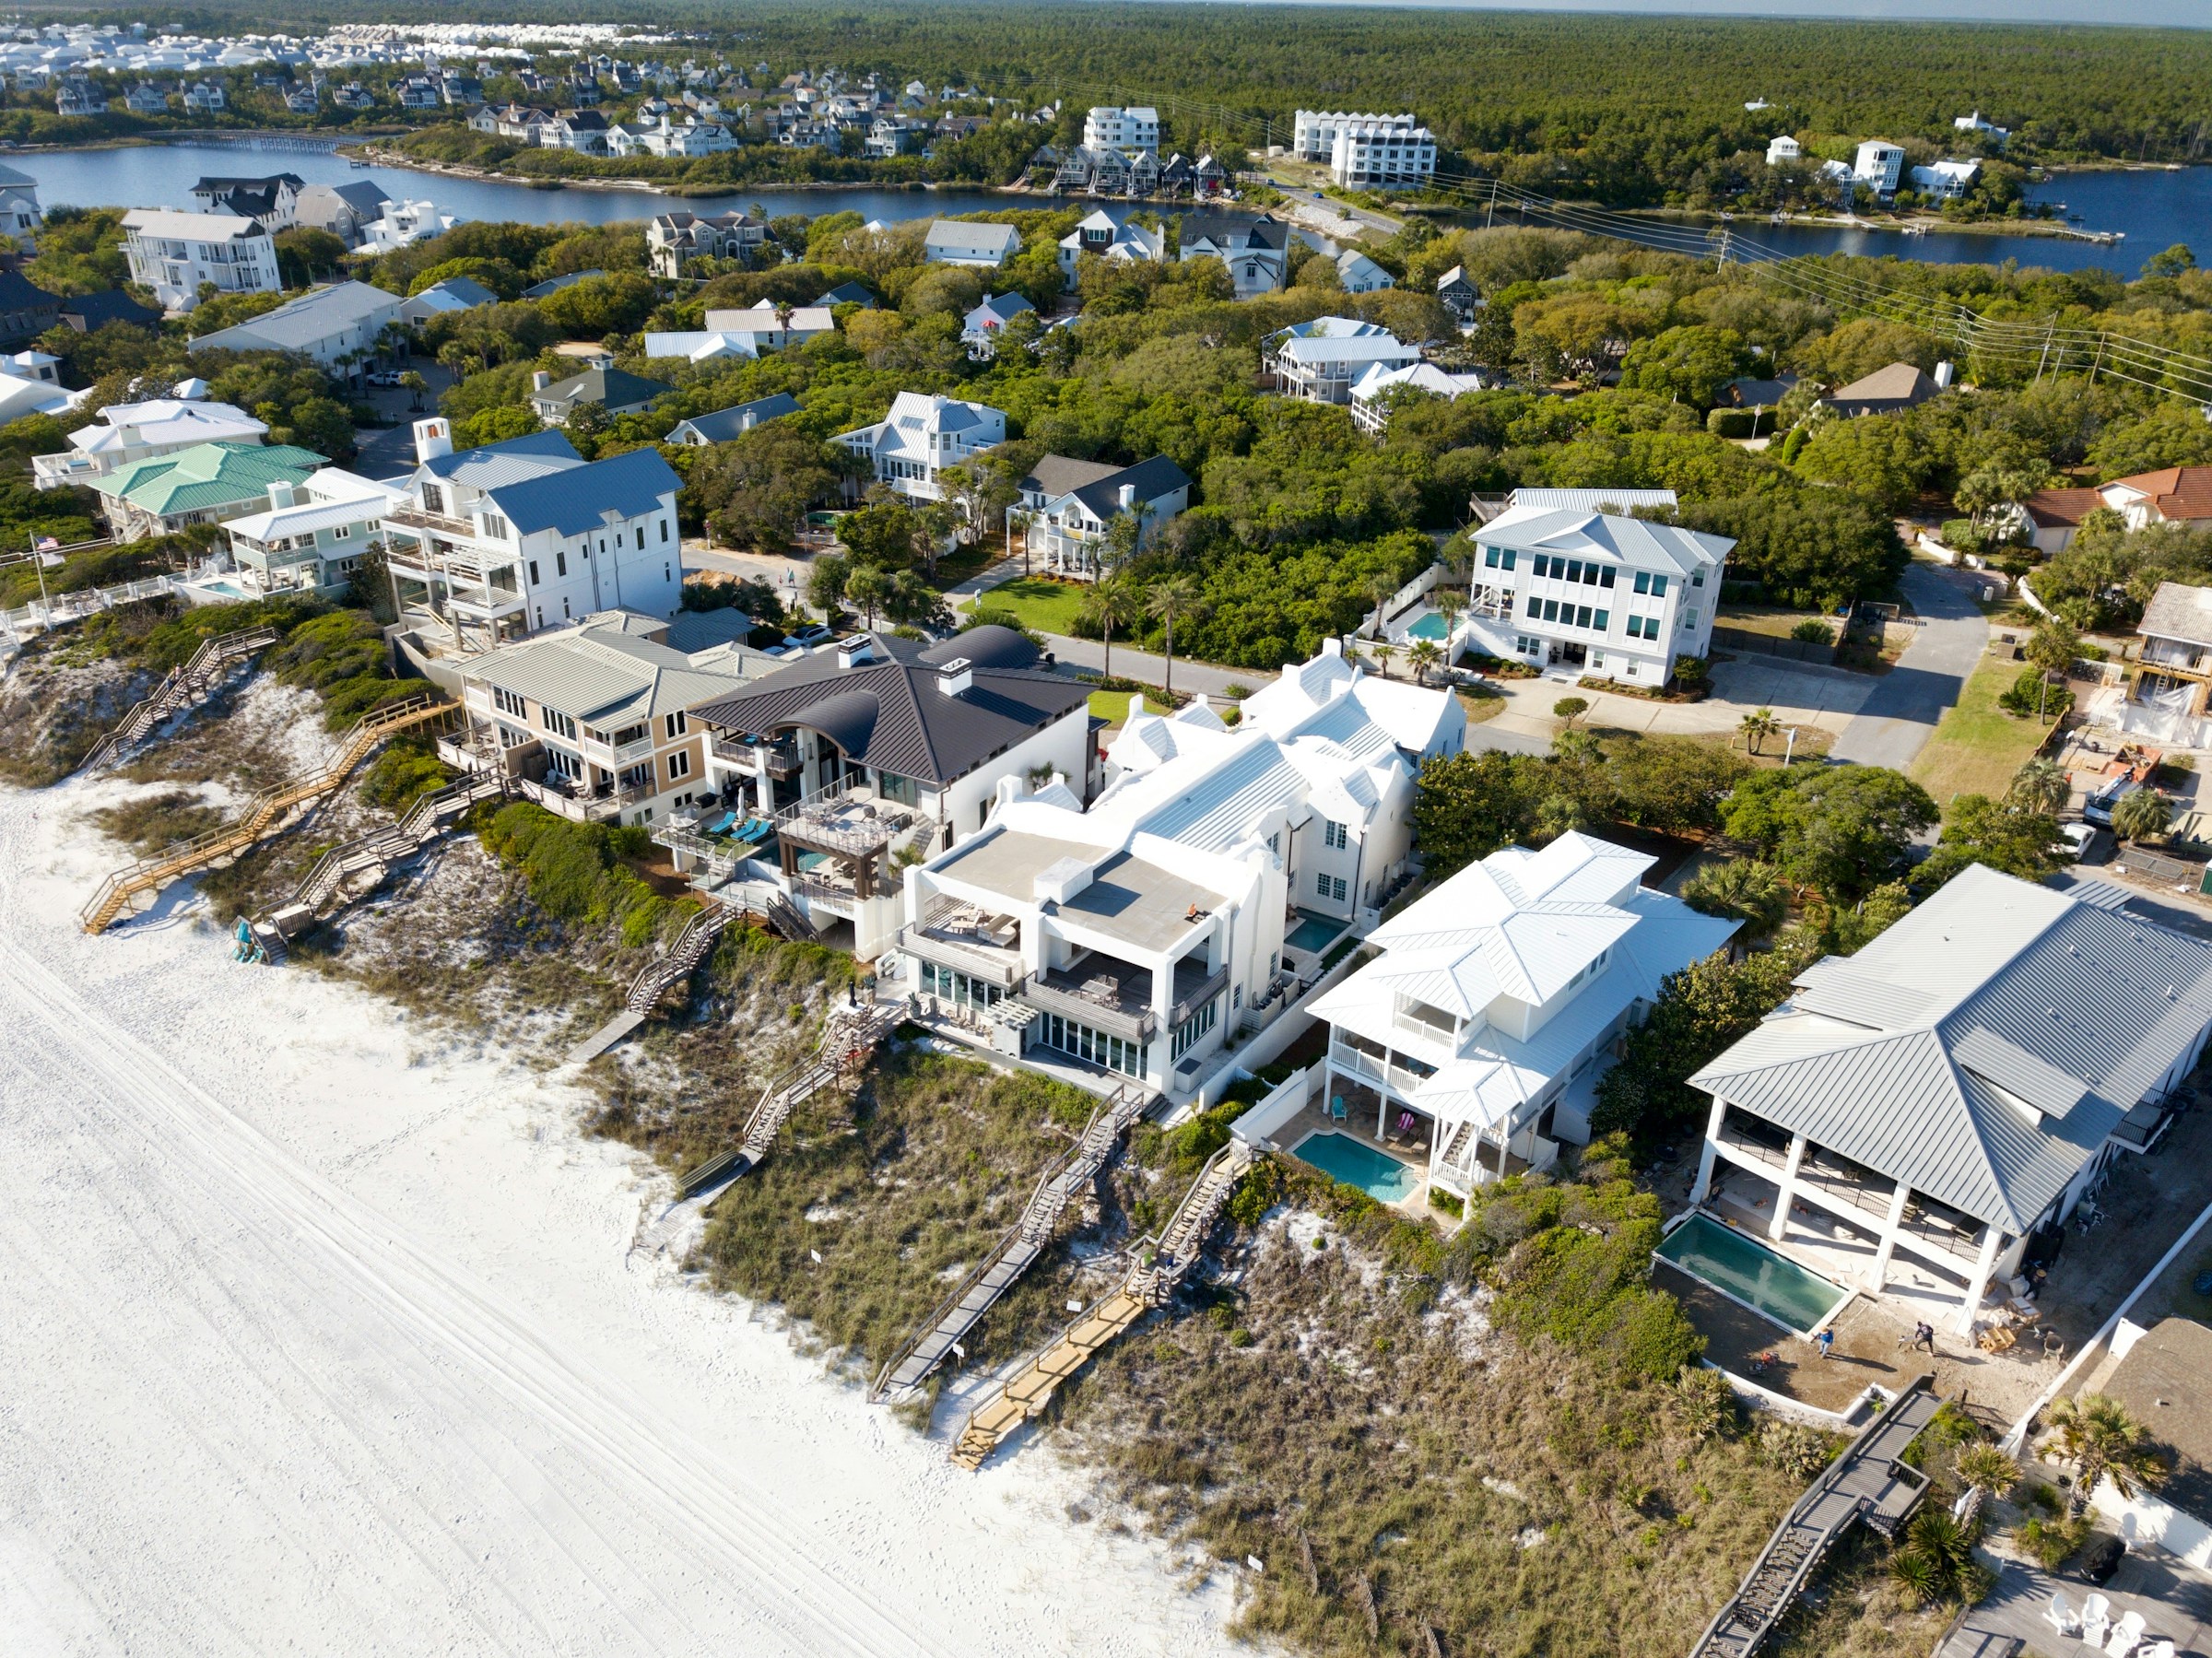
Gulf Shores, Alabama location imagery, not the client property

Location photography: Gulf Shores, Alabama. goodrich kingrey / Unsplash. Not the client property.

The property context

A second year.
A fuller performance picture.

Follow the whole season, including the dates that did not grow.

Rental revenue was higher in nine of the ten matched months. July remained the largest month: $34,929 in 2025 and $36,905 in 2026.

October moved from $15,253 to $14,799, a decline of $454. The positive period total does not mean every month improved.

The source reports summer occupancy of 94–97% for the home, compared with a market range of 63–90%, across May–September 2026. These are monthly ranges, not before-and-after averages.

This is a second-year operating comparison. Listing maturation and other changes can affect the result.

The reported management approach

Specific decisions.
Ongoing attention.

The source describes pricing and stay-rule adjustments. These are reported actions, rather than a test of what caused the revenue change.

01 / RATE BOUNDARIES

Establish a base and boundaries.

The source describes base, floor, and ceiling prices set at launch, followed by ongoing adjustments.

02 / DEMAND SIGNALS

Respond as demand develops.

Reported changes included premiums of up to 30% as the market filled and minimum-price increases in $50 steps as pace improved.

03 / CALENDAR GAPS

Work with the remaining nights.

The account describes $50 reductions in maximum prices to sell one- or two-night gaps, alongside seasonal minimum stays of three nights at peak.

100+

reported pricing adjustments

Reported since launch. This activity count has a different time span from the January–October revenue comparison.

A transparent comparison

What these
numbers show.

January–October 2025 vs. January–October 2026. This is a second-year operating comparison. Listing maturation and other changes can affect the result.

Property and period
Three-bedroom home in Gulf Shores, Alabama. January–October 2025 vs. January–October 2026. Mira management began January 2025.
Revenue definition
Reported nightly accommodation revenue, excluding cleaning fees and taxes, before Mira service fees and operating costs. It is not owner profit, a net return, or a guaranteed result.
The calculation
$186,515 − $162,644 = $23,871. Dividing the increase by $162,644 gives 14.7%, rounded to one decimal place.
Source, comparison, and limitations

One three-bedroom home. Mira management began January 2025. Both January–October periods were managed by Mira; no full before-Mira season is available.

The 94–97% property and 63–90% market occupancy figures are ranges across May–September 2026, not matched yearly averages.

The reported 2.1× RevPAR index covers January–October 2026. The source defines this as property RevPAR divided by local PriceLabs market RevPAR.

Saved market-rank claims have been omitted because they require a fresh Market Dashboard check.

The Mira client-results draft uses RCC and PriceLabs data through October 2026. Monthly values reconcile to the displayed totals; underlying reservation records and adjustment logs have not been independently validated.

Other property changes, availability, marketing, and demand can affect a comparison. These selected stories do not establish causal attribution, typical results, owner profit, or a return on Mira's fees. Client identities remain anonymous.

Photography shows the stated location, not the anonymous client's property.

Draft evidence for review · Source records await validation before public release.

Start with your numbers

What could a closer
look reveal?

Bring your property details, current approach, and performance questions. Let's discuss the revenue management support your business needs.

Request a revenue assessment ← Back to client results