Before and after

Inlet Beach,
Florida.

One five-bedroom home.
A different revenue picture.

A single-property owner began working with Mira in March 2026. Across April–October, rental revenue increased from $94,622 in 2025 to $148,297 in 2026.

This is the same home over the same seven calendar months. The observed increase was $53,675, or 56.7%.

FIVE-BEDROOM HOMEONE PROPERTYJOINED MARCH 2026

Selected result; outcomes vary. Revenue before service fees and operating costs. Source records await validation.

Same property. Same seven months.

+56.7%

April–October 2025 vs. April–October 2026
Rental revenue, before service fees and operating costs.

+$53,675

More rental revenue across the same seven months.

53% → 75%

Reported property occupancy, up 22 percentage points.

7 months

April–October compared across both years.

The comparison in detail

Seven months.
Every month in view.

Rental revenue was higher in each of the 7 matched months. The charts keep the calendar periods consistent and the measures separate.

RENTAL REVENUE

Month by month.

20252026

April–October 2025 vs. April–October 2026.

Monthly rental revenue in dollars. Exact values are available in the data table below.
View the revenue data
Monthly rental revenue in dollars
Month20252026
Apr$8,132$14,179
May$11,915$23,982
Jun$25,474$34,107
Jul$25,067$32,417
Aug$13,166$17,065
Sep$4,210$10,982
Oct$6,658$15,565
Total$94,622$148,297

OCCUPANCY

Property and market.

April–October in both years. Rates as reported in the source.

View the occupancy data
Reported occupancy in comparable periods
Measure20252026
The property53%75%
The local market66%70%

Available-night definitions and blocked-night treatment require source confirmation before publication.

Source: Mira client-results draft, November 2026 . Displayed arithmetic checked; underlying source records await validation. Selected individual results; outcomes vary.

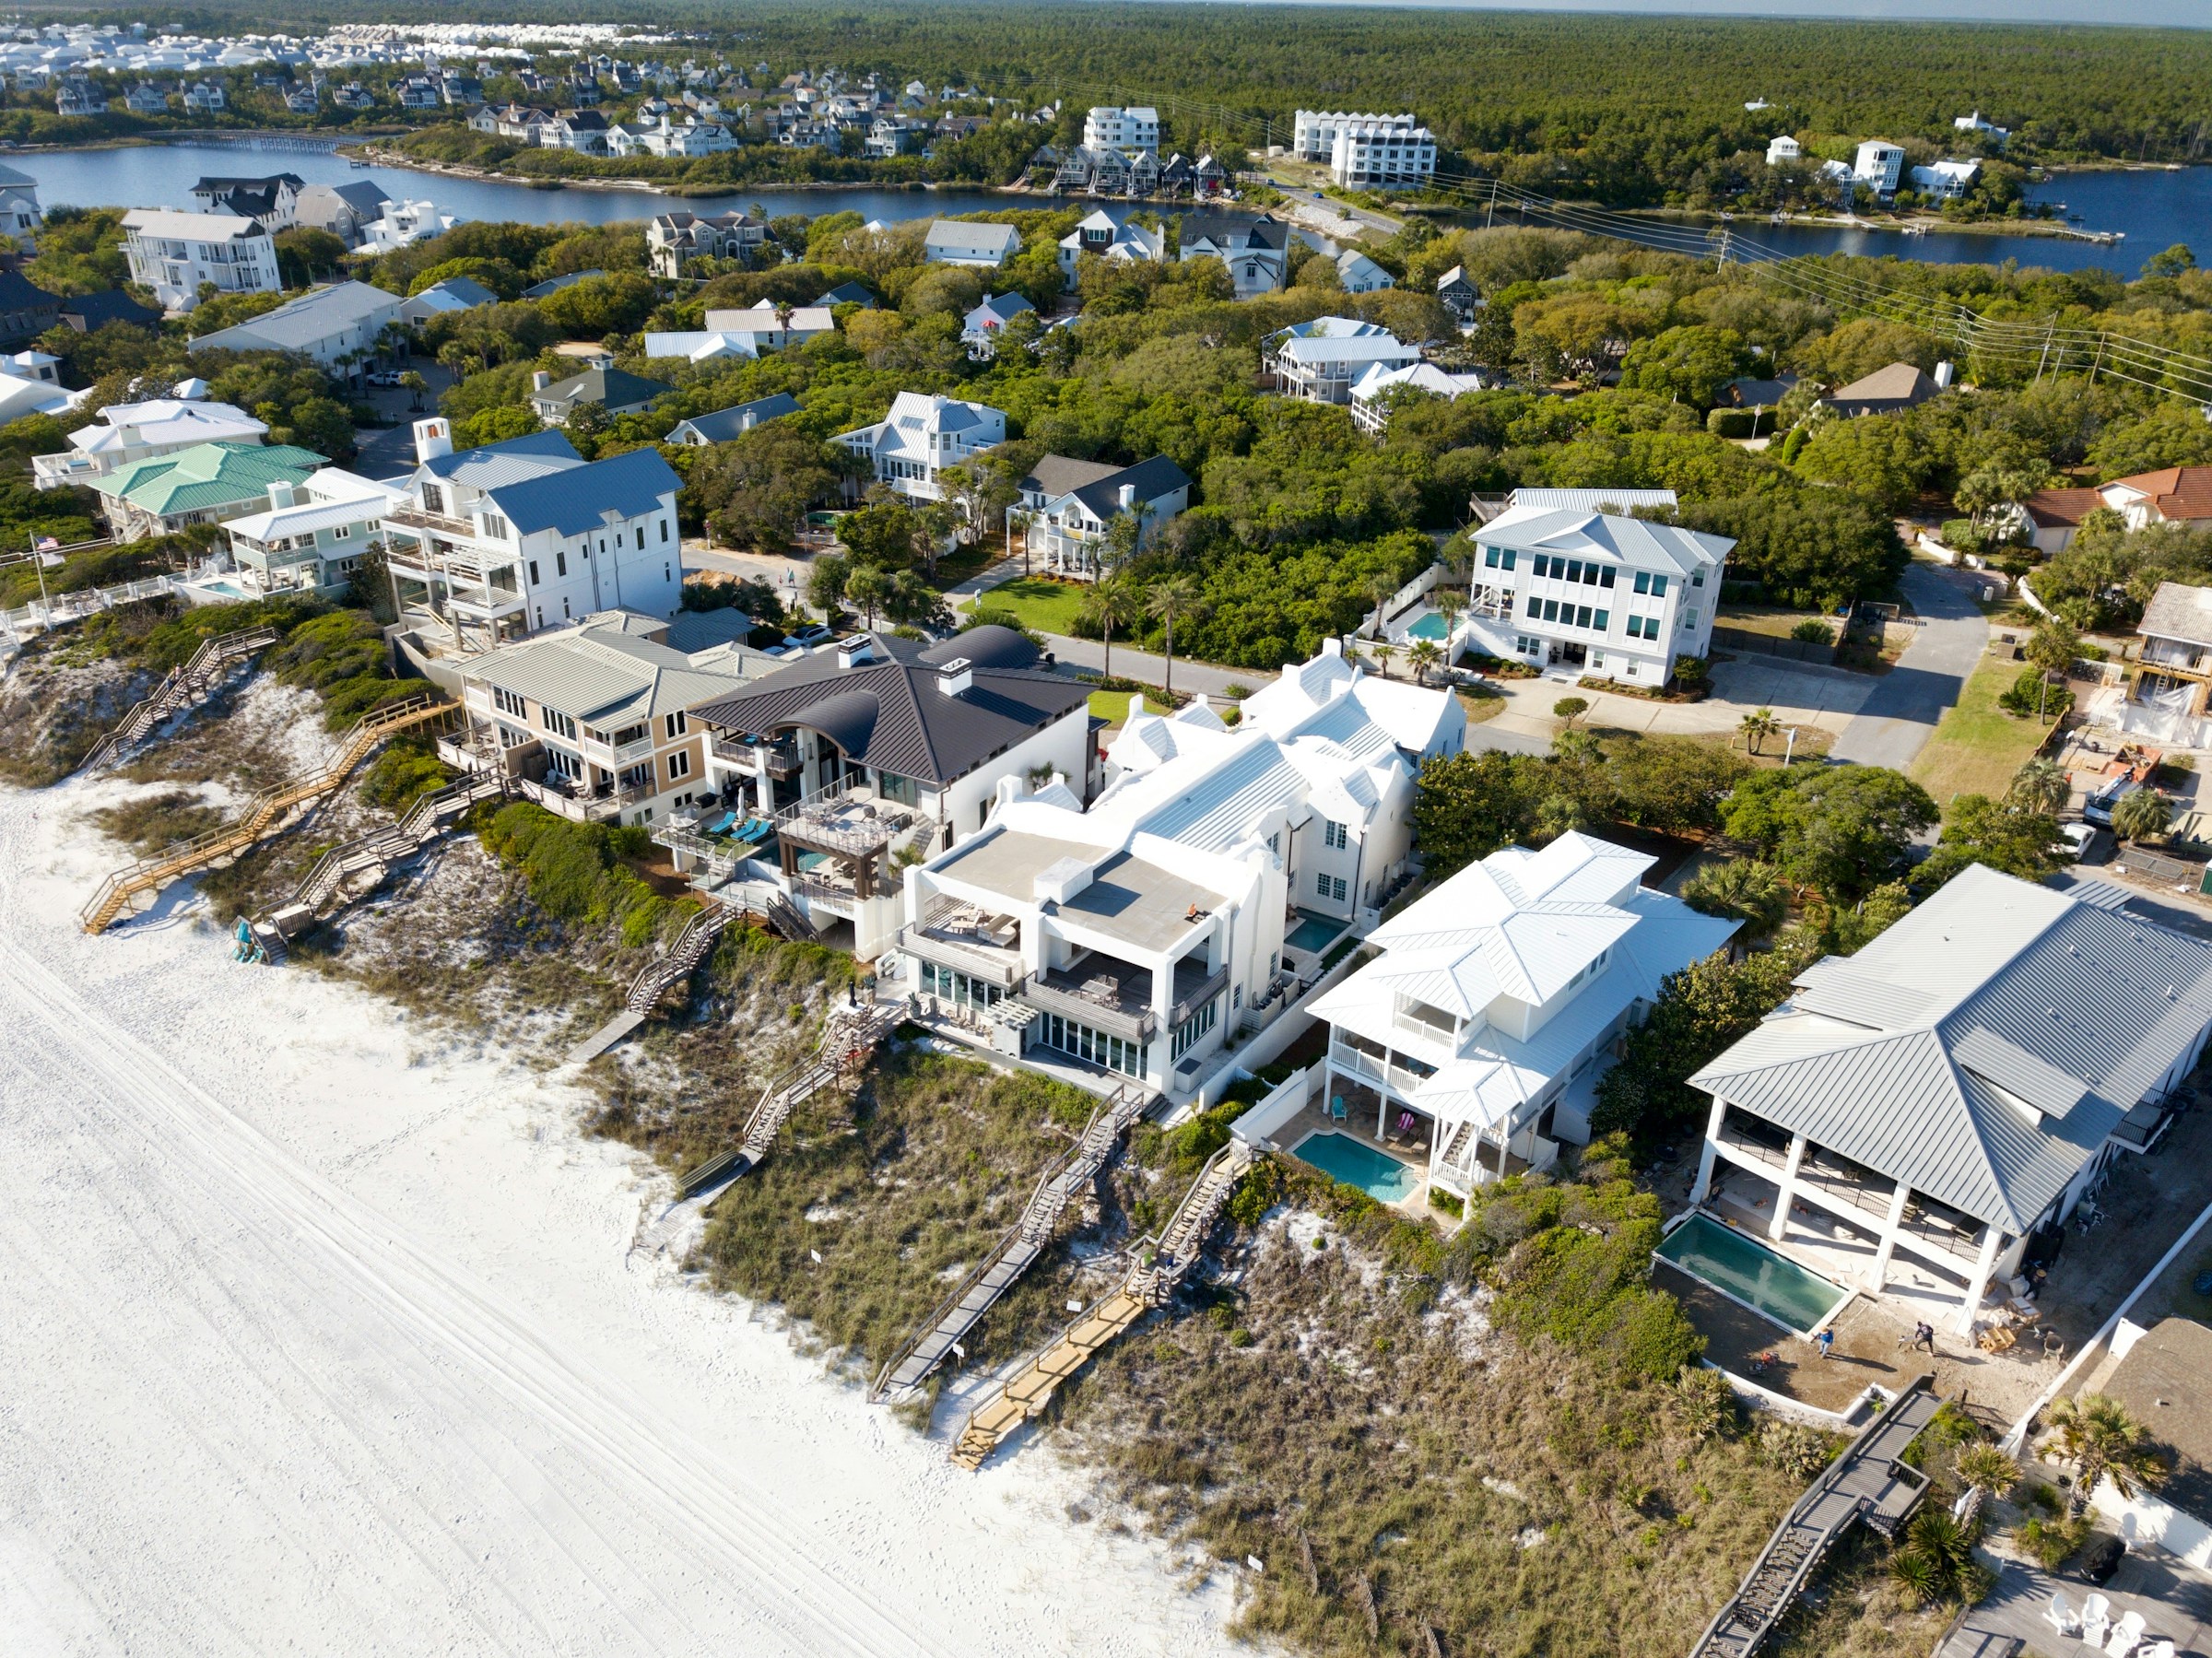
Alys Beach, Inlet Beach, United States location imagery, not the client property

Location photography: Alys Beach, Inlet Beach, United States. Bridger Bowcutt / Unsplash. Not the client property.

The property context

The same home.
A closer look at demand.

A coastal property needs a strategy for the quieter dates as well as peak season.

June and July together brought $66,524 in 2026, compared with $50,541 in the same months of 2025.

September rental revenue moved from $4,210 to $10,982; October moved from $6,658 to $15,565. Those differences are visible in the monthly comparison.

Reported occupancy rose for the property and the local market. Occupancy and total rental revenue measure different things.

The comparison does not isolate pricing from availability, property presentation, or other changes.

The reported management approach

Specific decisions.
Ongoing attention.

The source describes pricing and stay-rule adjustments. These are reported actions, rather than a test of what caused the revenue change.

01 / STAY RULES

More flexibility on shoulder dates.

The reported approach reduced minimum stays from three nights to two on selected shoulder-season dates.

02 / BOOKING PACE

Respond when pace lags.

Last-minute floor adjustments and small discounts were used when booking pace fell behind expectations.

03 / PEAK DEMAND

Price for high-demand dates.

The account describes roughly 10% premiums around holidays and spring break.

237

reported pricing moves

Across the seven-month window. Activity describes the management process; it does not establish which action produced a booking or revenue change.

A transparent comparison

What these
numbers show.

April–October 2025 vs. April–October 2026. The comparison does not isolate pricing from availability, property presentation, or other changes.

Property and period
Five-bedroom home in Inlet Beach, Florida. April–October 2025 vs. April–October 2026. Mira management began March 2026.
Revenue definition
Reported nightly accommodation revenue, excluding cleaning fees and taxes, before Mira service fees and operating costs. It is not owner profit, a net return, or a guaranteed result.
The calculation
$148,297 − $94,622 = $53,675. Dividing the increase by $94,622 gives 56.7%, rounded to one decimal place.
Source, comparison, and limitations

One five-bedroom home. Mira management began March 2026. The comparison uses the same April–October calendar months in each year.

Occupancy is reported as 53% and 75% for the home, and 66% and 70% for the local market. Available-night denominators and blocked-night treatment require source confirmation.

The market RevPAR change has been omitted pending confirmation against the underlying market data.

The Mira client-results draft uses RCC and PriceLabs data through October 2026. Monthly values reconcile to the displayed totals; underlying reservation records and adjustment logs have not been independently validated.

Other property changes, availability, marketing, and demand can affect a comparison. These selected stories do not establish causal attribution, typical results, owner profit, or a return on Mira's fees. Client identities remain anonymous.

Photography shows the stated location, not the anonymous client's property.

Draft evidence for review · Source records await validation before public release.

Start with your numbers

What could a closer
look reveal?

Bring your property details, current approach, and performance questions. Let's discuss the revenue management support your business needs.

Request a revenue assessment ← Back to client results