
RENTAL REVENUE
Month by month.
20252026
May–July 2025 vs. May–July 2026.
May
Jun
Jul
View the revenue data
| Month | 2025 | 2026 |
|---|---|---|
| May | $10,792 | $18,912 |
| Jun | $10,260 | $15,080 |
| Jul | $9,806 | $15,022 |
| Total | $30,858 | $49,014 |
Summer comparison
Three summer months.
A different revenue picture.
This five-bedroom estate opened in April 2025. Mira took over pricing in late August 2025, after the first summer in the comparison.
Rental revenue for May–July rose from $30,858 in 2025 to $49,014 in 2026, an increase of $18,156 or 58.8%. Local market RevPAR declined 9.0% over the same months.
Selected result; outcomes vary. Revenue before service fees and operating costs. Source records await validation.
+58.8%
May–July 2025 vs. May–July 2026
Rental revenue, before service fees and operating costs.
Observed rental-revenue change across May–July.
Reported property occupancy, up 11 percentage points.
Local market RevPAR change over the same months.
The comparison in detail
Rental revenue was higher in each of the 3 matched months. The charts keep the calendar periods consistent and the measures separate.
RENTAL REVENUE
May–July 2025 vs. May–July 2026.
| Month | 2025 | 2026 |
|---|---|---|
| May | $10,792 | $18,912 |
| Jun | $10,260 | $15,080 |
| Jul | $9,806 | $15,022 |
| Total | $30,858 | $49,014 |
OCCUPANCY
May–July in both years. The source describes local market occupancy as approximately 60%, without a separate before-and-after pair.
| Measure | 2025 | 2026 |
|---|---|---|
| The property | 88% | 99% |
Available-night definitions and blocked-night treatment require source confirmation before publication.
Source: Mira client-results draft, November 2026 . Displayed arithmetic checked; underlying source records await validation. Selected individual results; outcomes vary.
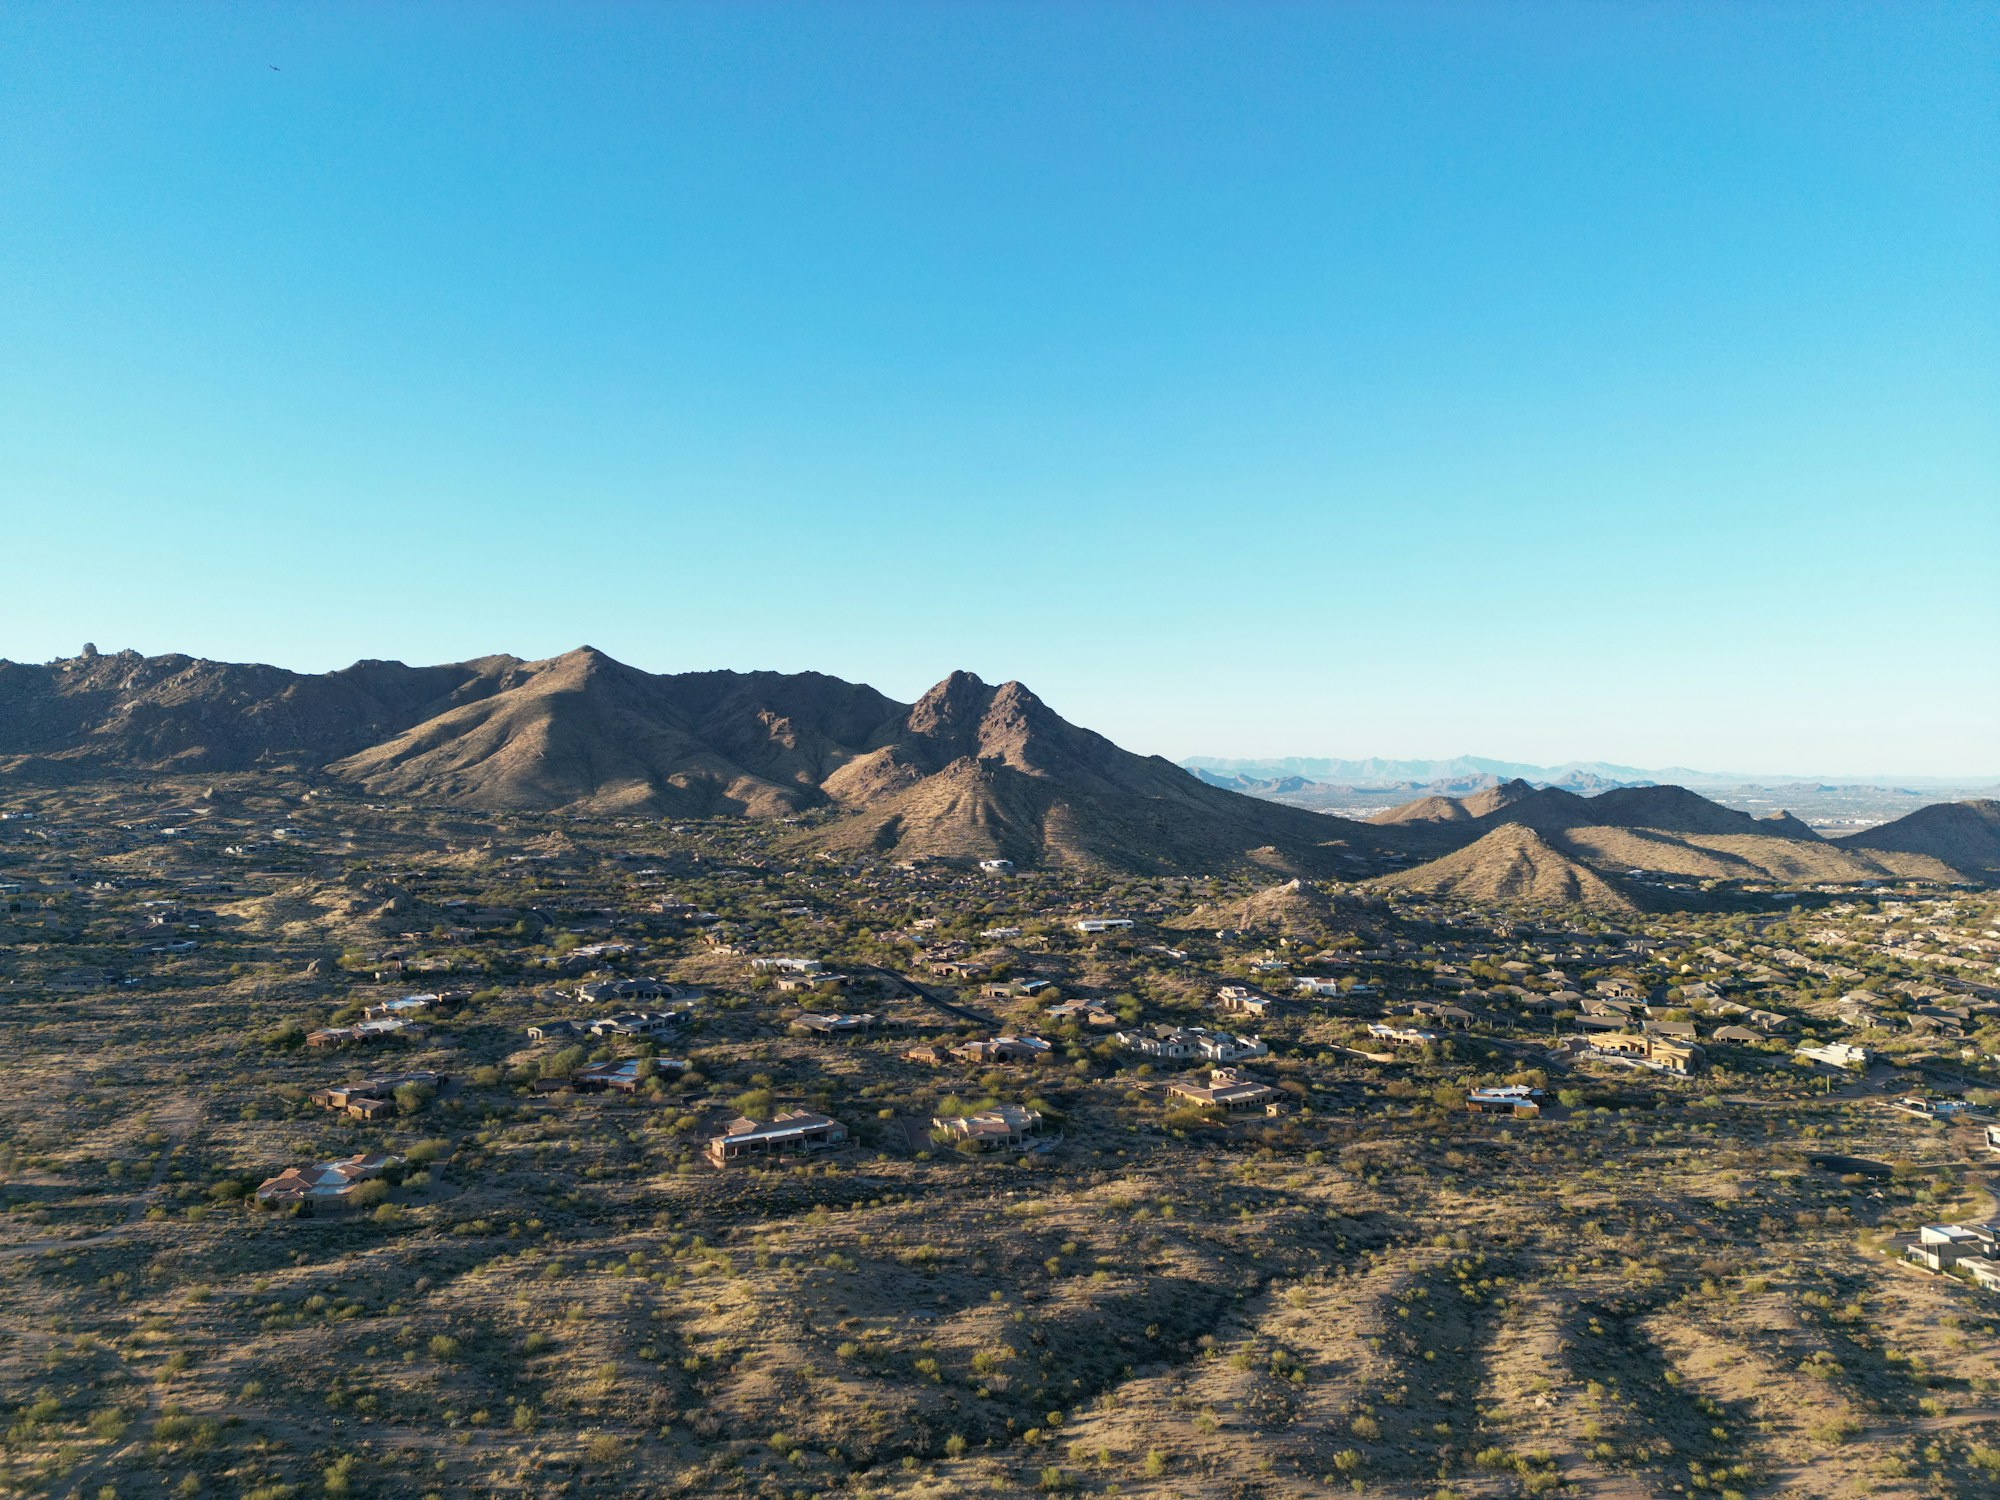
Location photography: Scottsdale, Arizona. Logan Voss / Unsplash. Not the client property.
The property context
Read the pricing story alongside the age of the listing.
The 2026 revenue total was higher in each of the three matched months. May increased from $10,792 to $18,912; June from $10,260 to $15,080; July from $9,806 to $15,022.
Reported property occupancy increased from 88% to 99%. The source describes local market occupancy as about 60% during the summer comparison.
The listing was new in the 2025 baseline. Building reviews and gaining operating history can contribute to growth, so the result cannot be attributed to pricing alone.
The baseline is the first summer of a new listing. Growth includes factors beyond pricing.
The reported management approach
The source describes pricing and stay-rule adjustments. These are reported actions, rather than a test of what caused the revenue change.
Reported floors were higher on event and holiday weekends and lower on selected midweek dates.
The account describes opening two-night stays on gaps that previously required four nights, with a 15% short-stay premium.
The source reports 10% increases when distant weekends booked early, larger event premiums, and small 5% reductions on softer dates.
Reported since August 2025. The activity window is broader than the May–July revenue comparison.
A transparent comparison
May–July 2025 vs. May–July 2026. The baseline is the first summer of a new listing. Growth includes factors beyond pricing.
One five-bedroom estate. May–July 2025 predates Mira; the same months of 2026 follow the late-August 2025 management start.
The property opened in April 2025. Review accumulation and listing maturation are material parts of the comparison.
The source reports occupancy of 88% and 99% for the property. Its approximate 60% market figure is not a separate annual pair and is not rendered as two market bars.
The source also reports a January–October RevPAR index and saved market rank. Those use different or unrefreshed evidence and are omitted from this summer comparison.
The Mira client-results draft uses RCC and PriceLabs data through October 2026. Monthly values reconcile to the displayed totals; underlying reservation records and adjustment logs have not been independently validated.
Other property changes, availability, marketing, and demand can affect a comparison. These selected stories do not establish causal attribution, typical results, owner profit, or a return on Mira's fees. Client identities remain anonymous.
Photography shows the stated location, not the anonymous client's property.
Draft evidence for review · Source records await validation before public release.
More client stories
 +56.7% rental revenue growth
Five-bedroom home
April–October 2025 vs. April–October 2026
Location photography: Alys Beach, Inlet Beach, United States. Bridger Bowcutt / Unsplash. Not the client property.
 +14.7% rental revenue growth
Three-bedroom home
January–October 2025 vs. January–October 2026
Location photography: Gulf Shores, Alabama. goodrich kingrey / Unsplash. Not the client property.
 +49.3% rental revenue growth
Nine-bedroom estate
May–October 2025 vs. May–October 2026
Location photography: Downtown Frankfort, Kentucky. Kaplansa / Wikimedia Commons · public domain. Not the client property.
Start with your numbers
Bring your property details, current approach, and performance questions. Let's discuss the revenue management support your business needs.
Request a revenue assessment ← Back to client results