Professional operator

Walnut Creek,
California.

An established operator.
Eleven matched months.

The owner was already operating these twelve units professionally when Mira took over pricing in June 2025.

Across July–May, the portfolio's rental revenue increased from $451,661 in 2024–25 to $540,567 in 2025–26. That is $88,906 more, or 19.7%, across eleven matched calendar months.

TWELVE-UNIT PORTFOLIO12 UNITSJOINED JUNE 2025

Selected result; outcomes vary. Revenue before service fees and operating costs. Source records await validation.

Same portfolio. Same eleven months.

+19.7%

July 2024–May 2025 vs. July 2025–May 2026
Rental revenue, before service fees and operating costs.

+$88,906

Observed rental-revenue change across the matched period.

12 units

The same professionally operated portfolio.

11 months

July–May in each window; June is excluded.

The comparison in detail

Eleven months.
Every month in view.

Rental revenue was higher in each of the 11 matched months. The charts keep the calendar periods consistent and the measures separate.

RENTAL REVENUE

Month by month.

2024–252025–26

July 2024–May 2025 vs. July 2025–May 2026.

Monthly rental revenue in dollars. Exact values are available in the data table below.
View the revenue data
Monthly rental revenue in dollars
Month2024–252025–26
Jul$47,204$56,142
Aug$36,420$52,677
Sep$38,168$45,144
Oct$40,529$47,332
Nov$39,206$48,270
Dec$41,223$44,422
Jan$34,133$41,251
Feb$36,308$42,394
Mar$38,976$50,377
Apr$43,663$53,191
May$55,831$59,367
Total$451,661$540,567

PERFORMANCE CONTEXT

The period matters.

12

Units in the reported professional portfolio.

11 matched months

July–May in each comparison window.

June excluded

The source pairs June 2024 with June 2026. This page uses only one-year pairs.

Recalculated from eleven source-table pairs. The inconsistent two-year June row is excluded and disclosed.

Source: Mira client-results draft, November 2026 . Displayed arithmetic checked; underlying source records await validation. Selected individual results; outcomes vary.

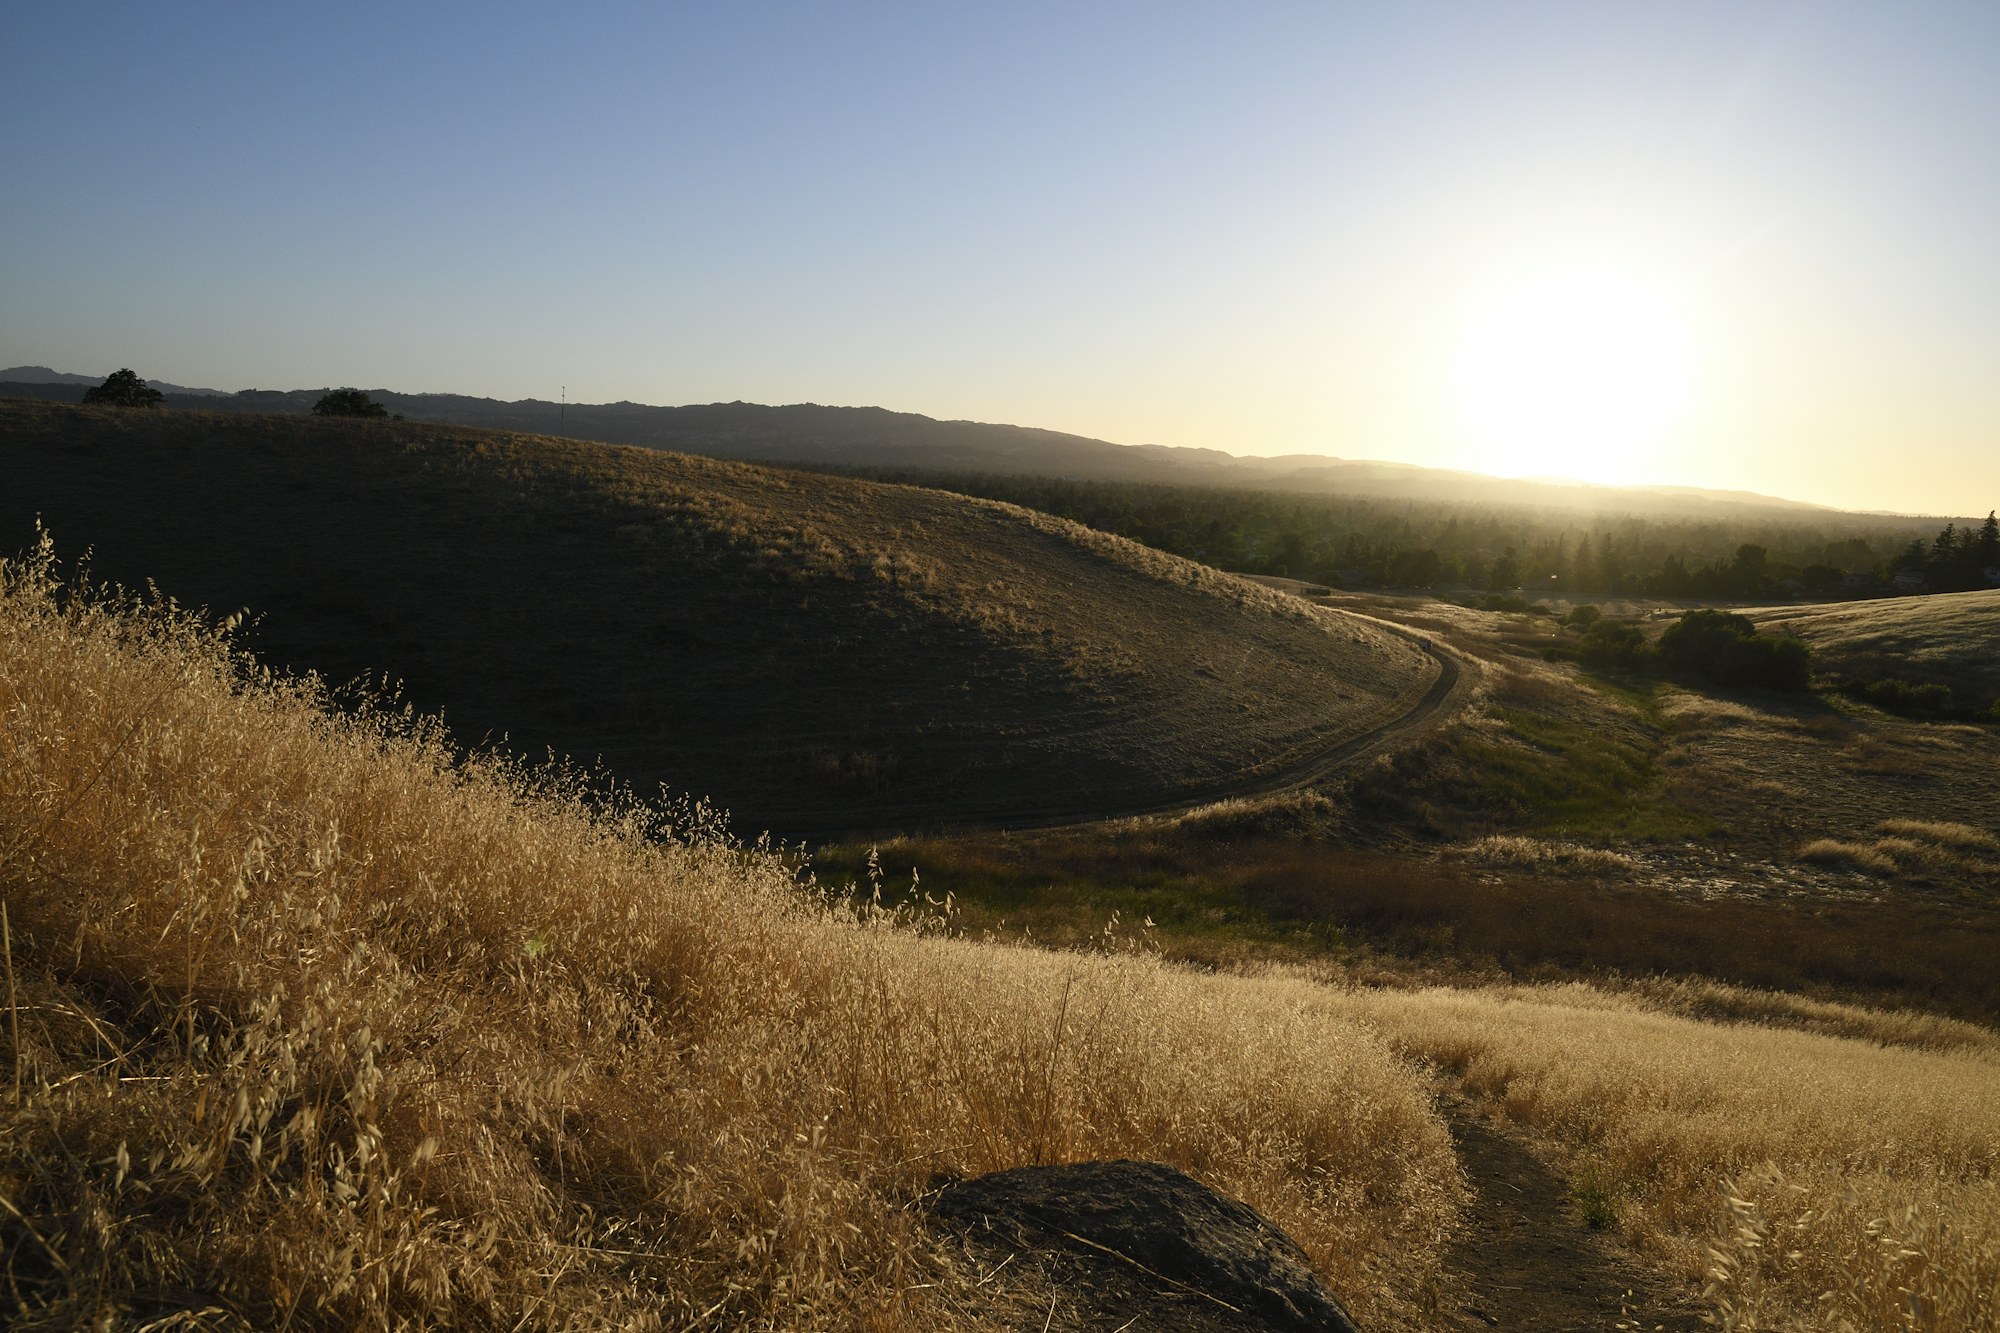
Lime Ridge, Walnut Creek, California location imagery, not the client property

Location photography: Lime Ridge, Walnut Creek, California. Mario Mesaglio / Unsplash. Not the client property.

The property context

An existing portfolio.
A consistent comparison.

A portfolio story should identify the months behind its headline.

The source contains twelve monthly pairs, but its June row compares 2024 with 2026. This page excludes that row and recalculates the eleven one-year pairs.

Revenue was higher in each included monthly pair. August moved from $36,420 to $52,677, while May moved from $55,831 to $59,367.

The resulting eleven-month comparison is not the source's twelve-month headline. No annualized outcome is inferred.

Recalculated from eleven source-table pairs. The inconsistent two-year June row is excluded and disclosed.

The reported management approach

Specific decisions.
Ongoing attention.

The source describes pricing and stay-rule adjustments. These are reported actions, rather than a test of what caused the revenue change.

01 / BOOKING CHECKS

Review the units individually.

The source describes daily booking checks and pricing changes across the twelve units.

02 / GAP NIGHTS

Open shorter stays where appropriate.

The account describes reducing selected minimum stays from two nights to one to address short calendar gaps.

03 / DEMAND AND DISTRIBUTION

Target changes to the dates.

Reported adjustments included 2–15% reductions on softer dates and 20–50% premiums on peak dates, pushed to linked channel listings.

1,400+

reported pricing moves

Across twelve units and sixteen months in the source. This activity period differs from the eleven-month revenue comparison.

A transparent comparison

What these
numbers show.

July 2024–May 2025 vs. July 2025–May 2026. Recalculated from eleven source-table pairs. The inconsistent two-year June row is excluded and disclosed.

Property and period
Twelve-unit portfolio in Walnut Creek, California. July 2024–May 2025 vs. July 2025–May 2026. Mira management began June 2025.
Revenue definition
Reported nightly accommodation revenue, excluding cleaning fees and taxes, before Mira service fees and operating costs. It is not owner profit, a net return, or a guaranteed result.
The calculation
$540,567 − $451,661 = $88,906. Dividing the increase by $451,661 gives 19.7%, rounded to one decimal place.
Source, comparison, and limitations

Twelve units in an existing professional operation. Mira took over in June 2025. This page compares July 2024–May 2025 with July 2025–May 2026.

The source June row reads June 2024 versus June 2026. It is excluded from both totals, leaving eleven matched one-year pairs. The original date anomaly remains unresolved.

The recalculated totals are $451,661 and $540,567. The $88,906 difference is 19.7% of the earlier total, rounded to one decimal. This is not a twelve-month or annualized claim.

The source’s 74.7%/85.7% occupancy averages, 3.9% nightly-rate increase, and ten-of-twelve unit-growth statement belong to its separate twelve-month window. They are not applied to this eleven-month comparison.

No eleven-month market RevPAR benchmark is supplied. The separate January–May market comparison is not presented as a benchmark for this full period.

The Mira client-results draft uses RCC and PriceLabs data through October 2026. Monthly values reconcile to the displayed totals; underlying reservation records and adjustment logs have not been independently validated.

Other property changes, availability, marketing, and demand can affect a comparison. These selected stories do not establish causal attribution, typical results, owner profit, or a return on Mira's fees. Client identities remain anonymous.

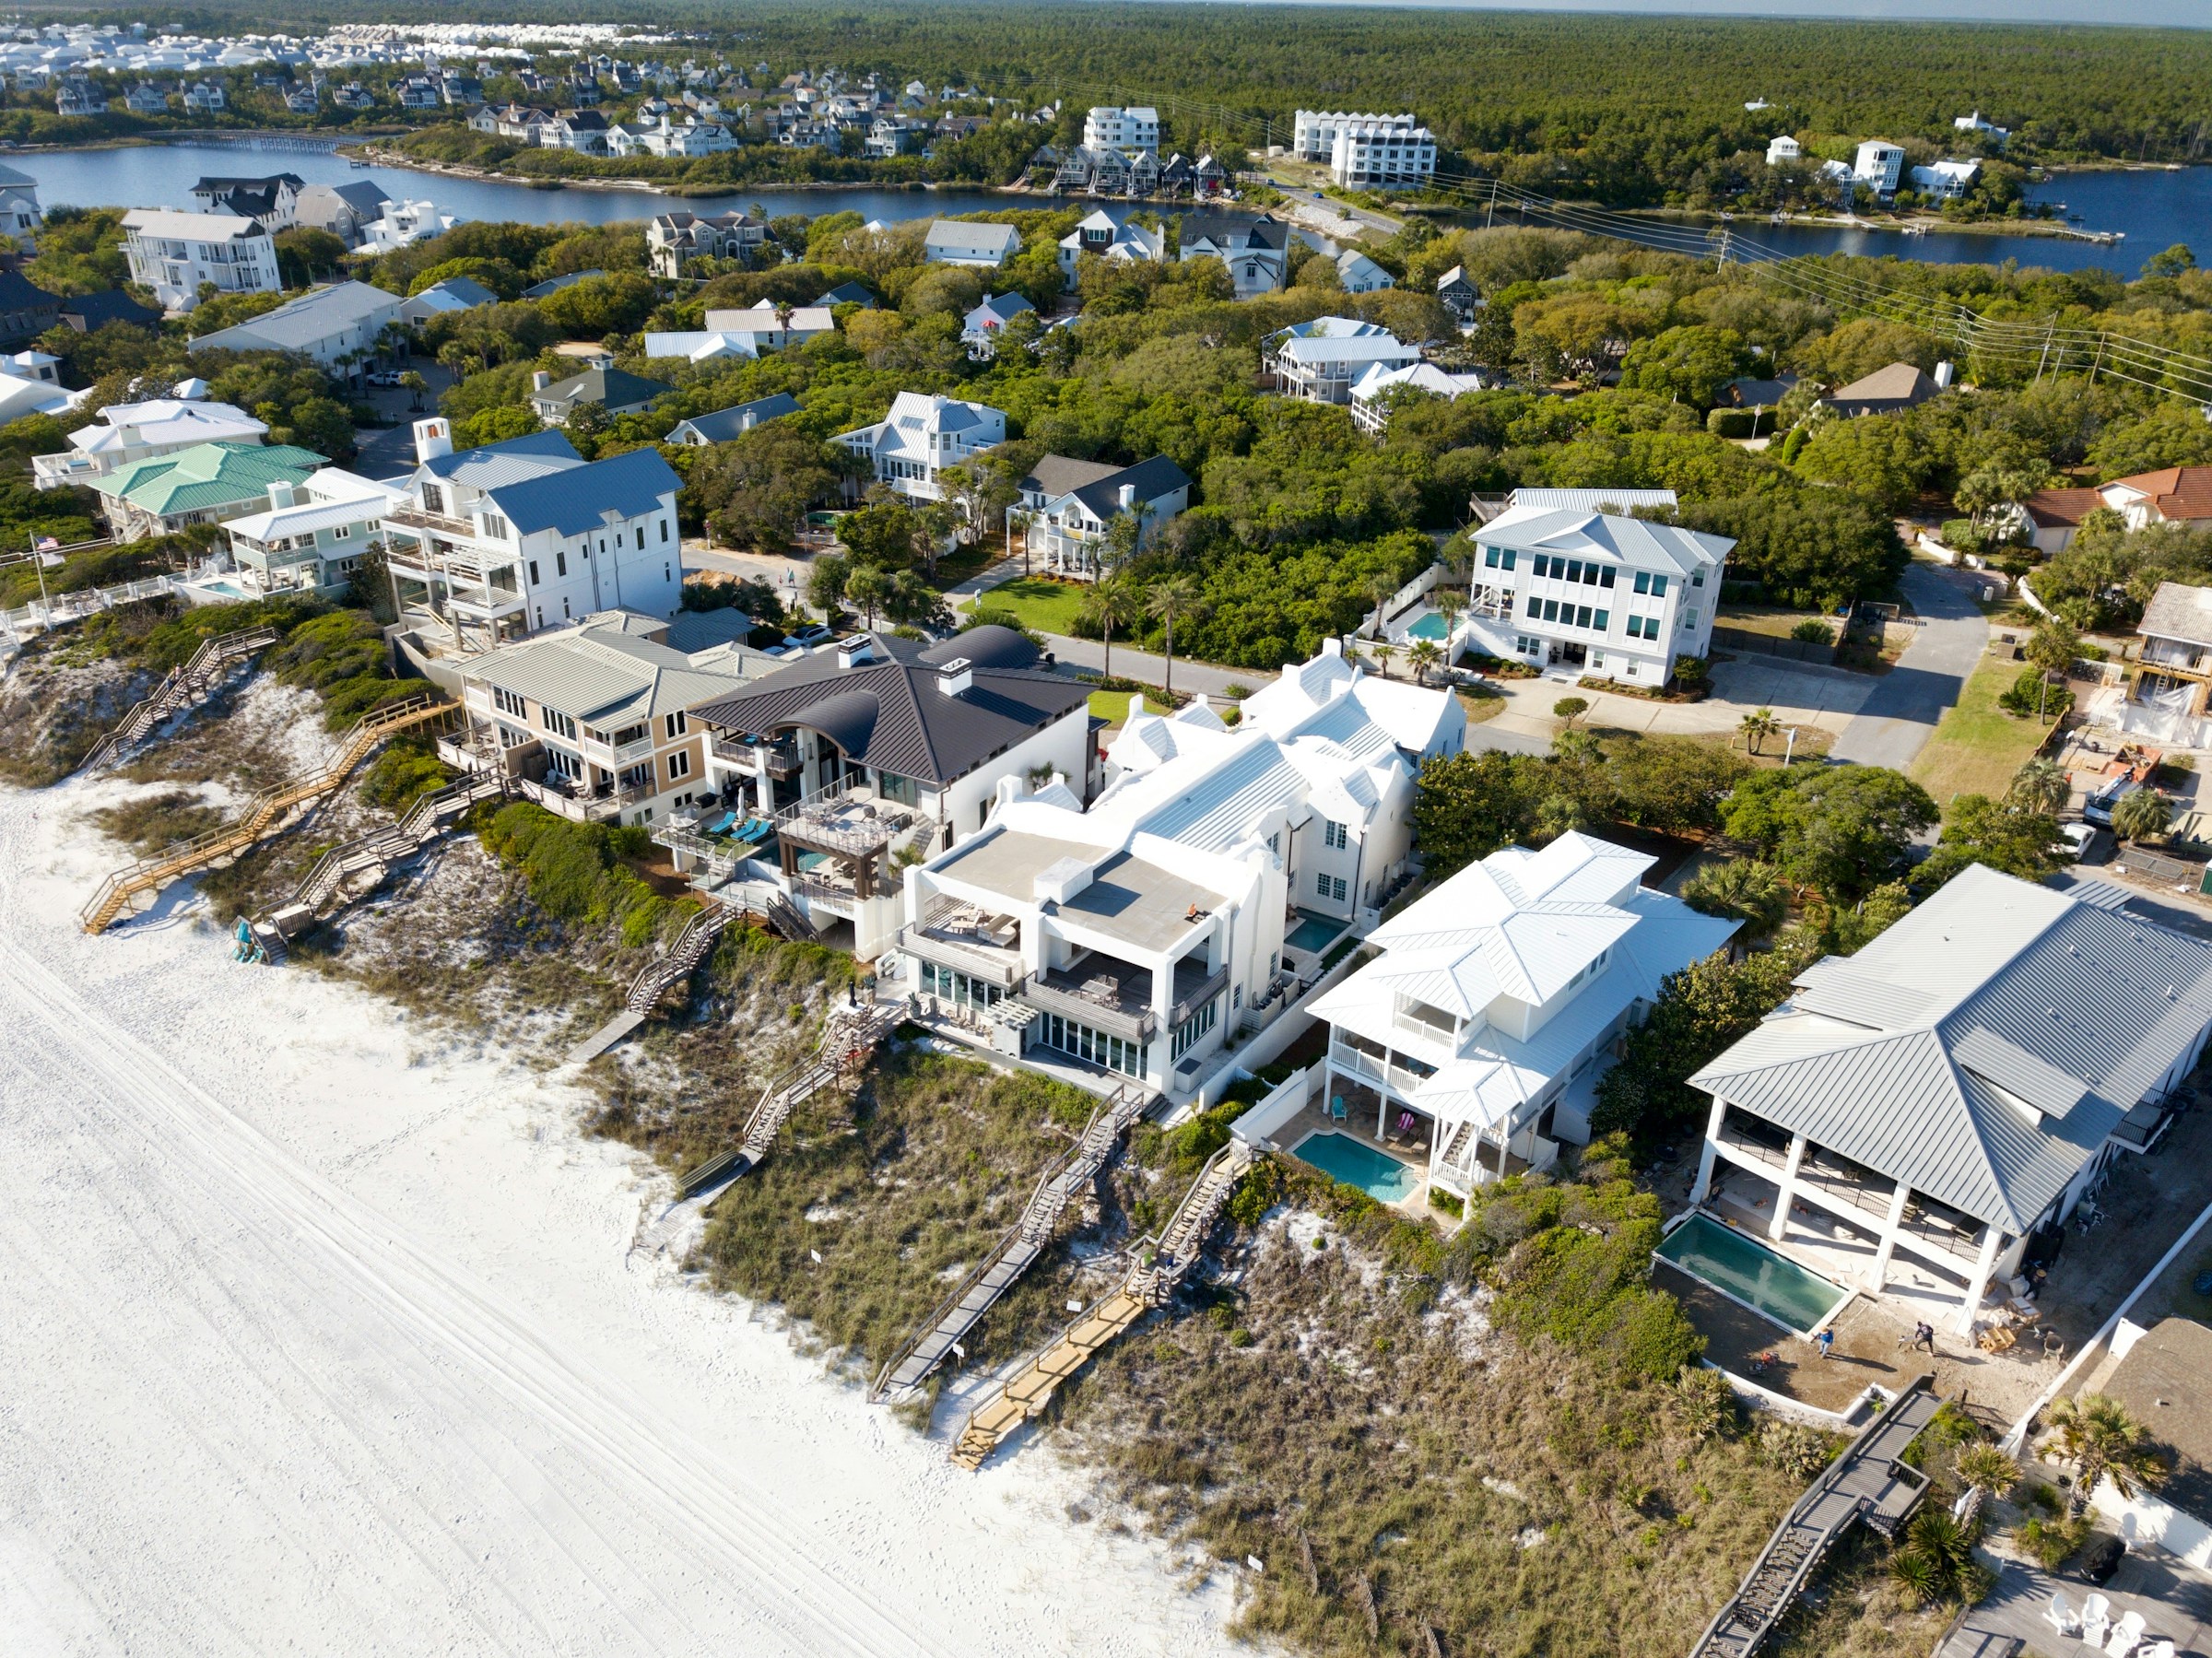
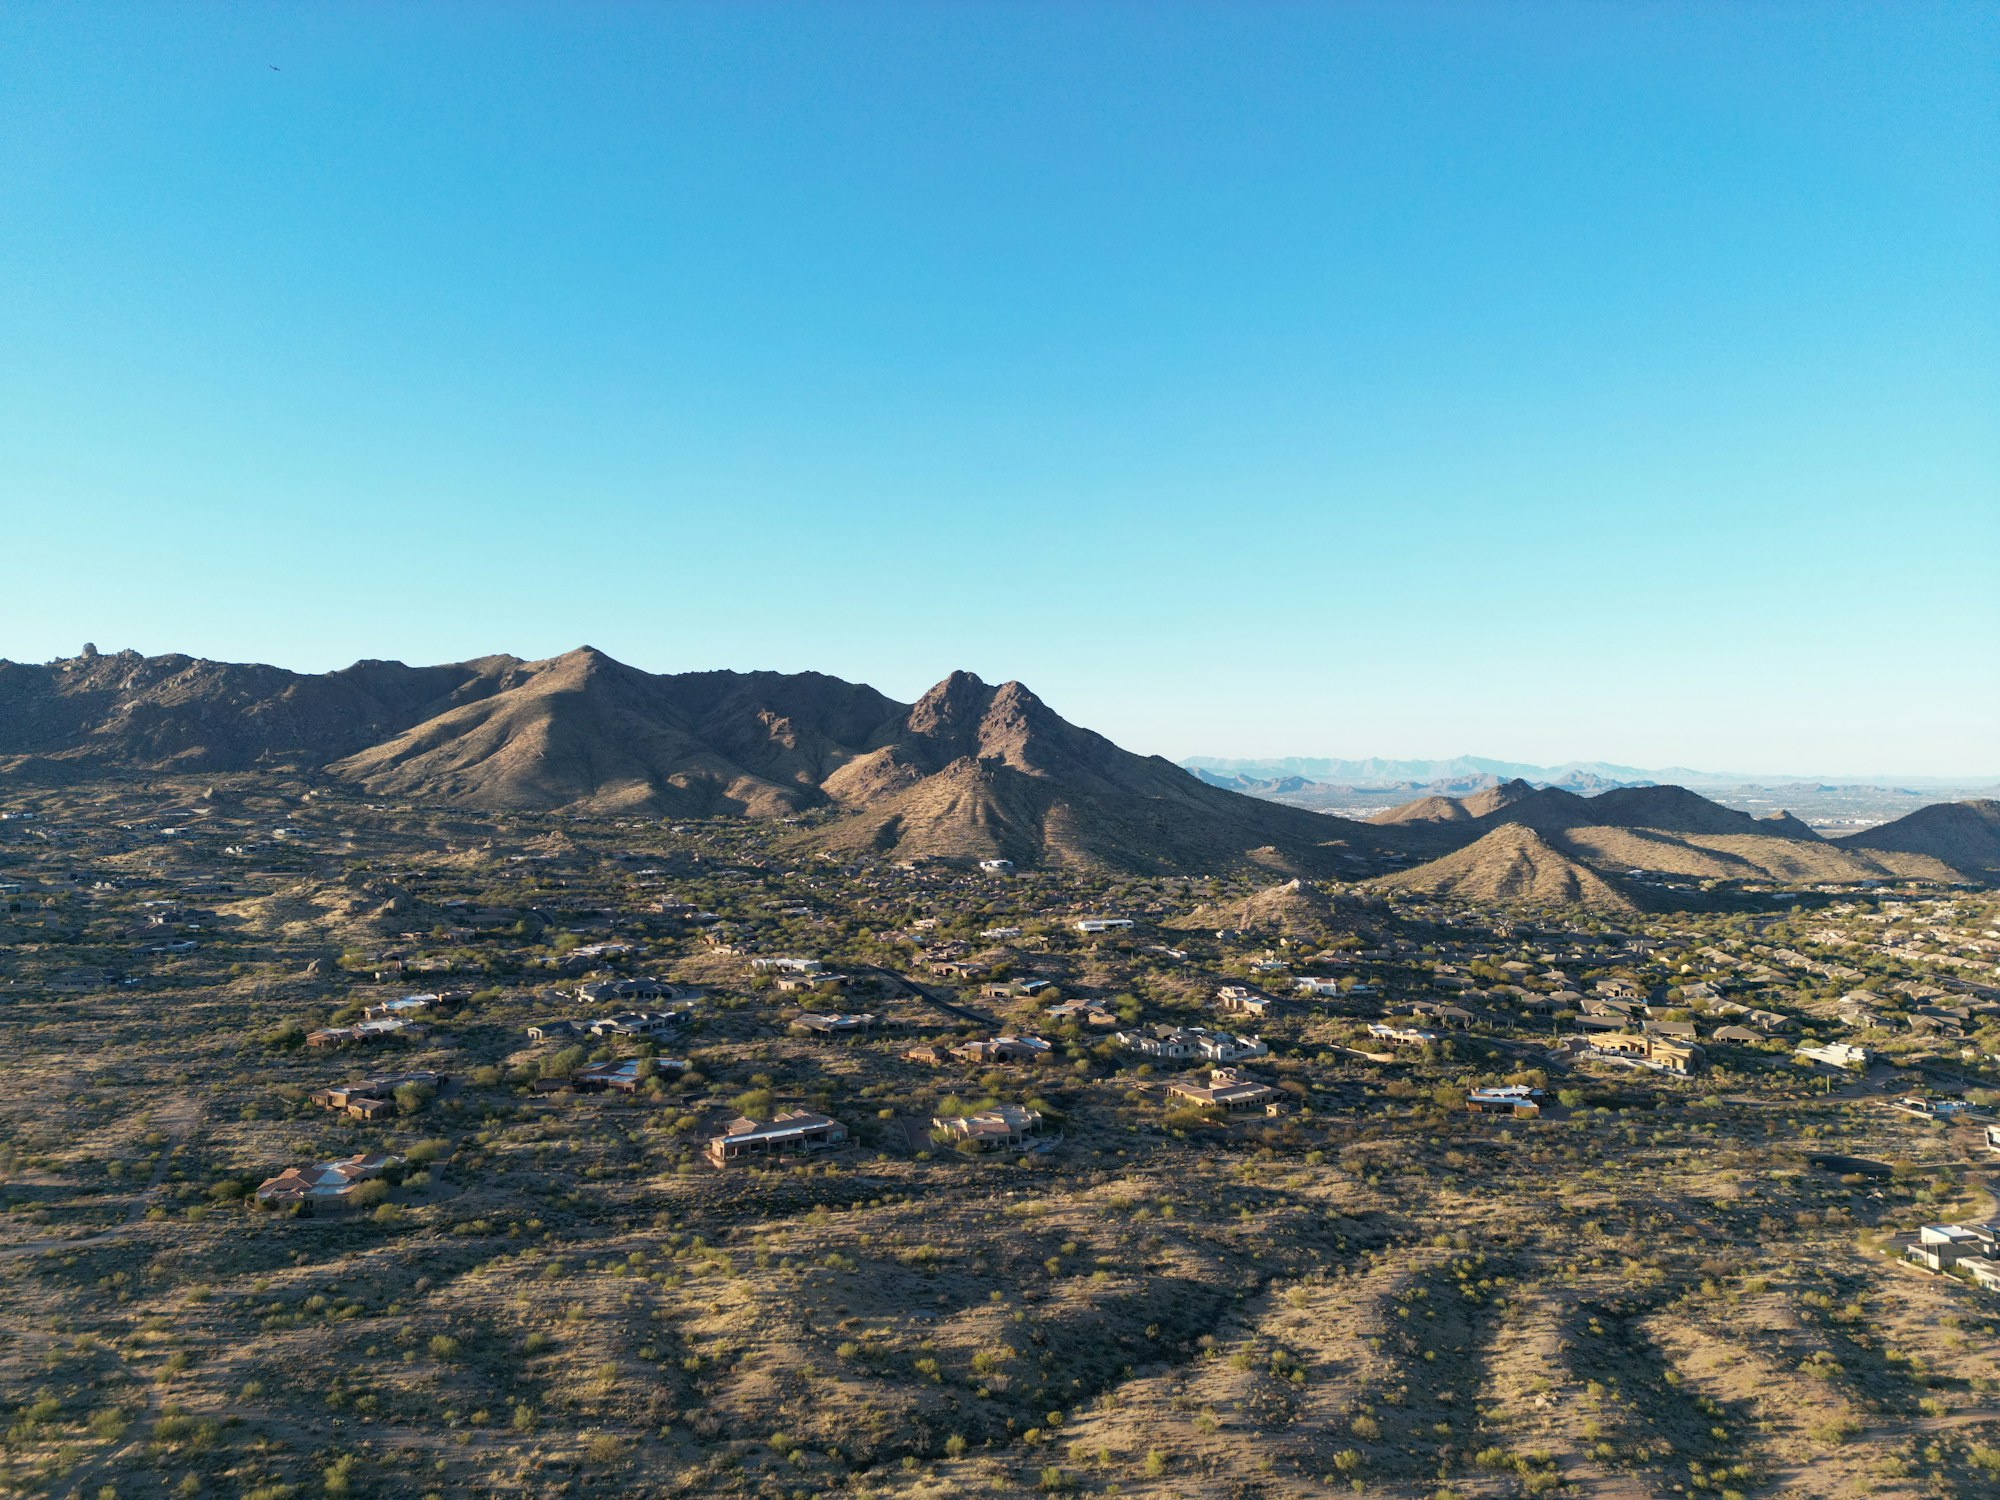
Photography shows the stated location, not the anonymous client's property.

Draft evidence for review · Source records await validation before public release.

Start with your numbers

What could a closer
look reveal?

Bring your property details, current approach, and performance questions. Let's discuss the revenue management support your business needs.

Request a revenue assessment ← Back to client results